The Flexspace Observatory Bonus Track: Rates Popularity by Coworking Size
A few months ago we analysed flex workspace tenure from different perspectives. During the initial stages of our research, the Nexudus data team works with a large number of records trying to bring you those that are most relevant. Much of the information that is discarded is actually necessary in order to be able to look at an issue from different angles, to be able to confirm the information we send you.
However, in some cases, we find information that may not have the necessary length to create a complete report on that particular topic, but it is impossible for us not to share this with you!
One such insight is the popularity of each type of rate in the flexible workspace industry in general, and in the different types of space by size.
Contracts by rate
.jpg)
In the graph above we see the number of contracts in each type of rate in the sample. This data shows a reality that is hard to dispute: the flexible workspace industry has left behind the coworking industry that we saw evolve at the beginning of the last decade.
The industry has clearly moved from coworking, where the dedicated desk rate was the reigning rate, to an era where offices and Hot Desk dominate the industry landscape: the era of flexible workspaces.
When interpreting the data in the table above we must keep in mind that we are talking about contracts and, in the case of office rates, include, in most cases, more than one member. That is to say: an office for 10 people has only one contract, so the number of members, and square meters dedicated to this service, is much higher than the 33.4% of the contracts shown in the graph.
The percentage of Hot Desk member contracts is practically 50% higher than that of Dedicated Desk members. This figure is not subject to interpretation since each Hot Desk contract corresponds to one member at that rate.
The sector has therefore been dominated, until mid-2021, by spaces with a significant number of occupied offices and a large number of Hot Desk members.
Members on the latter tariff occupy spaces in common areas that are essential to provide good service to members on higher priced tariffs, such as office, or in areas that at different times of the day serve different functions (like events space) or both at the same time.
Flexible workspaces, therefore, opt, on average, for private office contracts that reduce management and for offering hot desks that allow them to monetise spaces such as the canteen or event areas at times when they have little to no use.
Contracts for each rate by coworking size
When talking about the flexible workspace industry we tend to think of smaller spaces as having more dedicated desk rate members: is that really what’s actually happening? Let's take a look at the chart below.
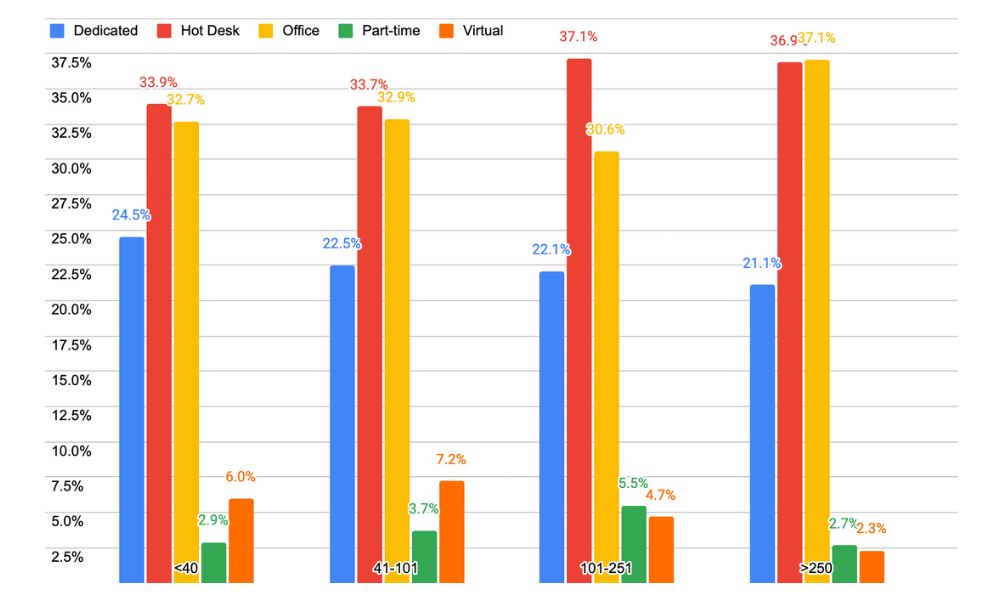
We can see that spaces with 40 or fewer members have 24.5% of the contracts on dedicated table rates, and, as the size of the space increases, we see how this percentage decreases to 21.1%. In other words, smaller venues have only 16% more dedicated table contracts than larger venues, a figure that, while not negligible, is much lower than one would expect at the outset.
We might have anticipated that the spaces with more than 100 members are the ones that have more members at hot desk rates, but we have found that on average it is 10%. We are not surprised since they have large common areas that they can monetise with members at these rates.
Other insights from the graph that have caught our attention are, for example:
For spaces between 101 and 250 members the percentage of office contracts is about 7% lower than for spaces between 41 and 100 members. The reason for this decrease is probably due to the fact that the office sizes increase and therefore the number of contracts decreases at a percentage level.
In spaces between 41 and 100 members virtual rates represent 7.2% of the contracts and for those of 40 or less members - 6%. This represents an increase of 213% when compared to spaces with more than 250 members, which have a lower value for this fee at only 2.3%. It is clear that smaller spaces sharpen the ingenuity to monetise this fee that can grow practically unlimitedly.
These are some of the insights that have caught the team's attention and we wanted to share them with you, but is there any data that has particularly caught your attention?
On future occasions, we will be able to evaluate how the extreme flexibility of recent years continues to evolve, and how spaces are solving the needs that the market poses to them every few months.
If you found this article interesting, head to the Flexspace Observatory where the Nexudus team analyses real workspace data to bring you reports that can help you further optimise the management of your space!
Related stories
Connection, Belonging, Identity: Why Branding Matters When You’re Building Your Community
Guided by industry insights, we navigate the intricate landscape of branding, probing fundamental questions posed by thought leaders like Cat Johnson. Beyond logos and colour schemes, we uncover the essence of brand identity.
Elevating mixed-use spaces: The crucial role of hospitality and technology in community management
As mixed-use developments continue to grow in popularity, merging visitors with locals through a high level of hospitality, and community, in whatever way the space functions, is of prime importance.
The glorious renaissance of community-led coworking
Join us in exploring how the coworking movement transcends beyond just providing desks and chairs- it's a catalyst for community and collaboration.
3 Things People Want From Their Workplace Experience
According to Appspace’s 2023 Workplace Experience Trends & Insights Report, 93% of people who work in an office think their organisation could do more to improve the workplace experience. To craft a truly exceptional workplace experience, it’s useful to know what people are actually looking for in an office environment – which, of course, can change over time. So, we decided to do a little digging.
Overturning a Man’s World: How Coworking Supports Women - Part 2
In this follow-up to the recent blog post, Overturning a Man’s World, we continue an exploration of how coworking supports women.
Building an Inclusive Workplace Experience at Huckletree
Huckletree, a longstanding customer of Nexudus, has a growing network of shared workspaces across the UK and Ireland. It represents a community of over 4,000 people working across dynamic tech and creative sectors including web3, fintech, AI, govtech, and sustainable innovation.
How To Make Your Coworking Software Work For Your Brand
With so many new and interesting coworking offerings emerging, it’s never been more vital for existing spaces to differentiate themselves and stand out. And one of the best ways to achieve this is by establishing a strong brand presence.
Behind The Desk: Meet Our Founders
Welcome to, where we dive deep into the brains behind Nexudus. Today, we’re chatting with Nexudus’ CTO and co-founder Adrian, as he shares his journey from selling Internet Cafe technology to being the co-founder of a global coworking company.
Creating Future-Ready Workspaces with Nexudus' Experts 🌍
We sat down with Stephen Wood, Nexudus’ North America Account Lead and our North American technology partner, Serge Rose, to talk about their recent collaboration in assisting a Canadian client with their migration to Nexudus and to delve into their thoughts on the future of technology in workspaces moving forward!
Overturning a Man’s World: How Coworking Supports Women
From beer taps to thermostat settings, we're examining how coworking can be a game-changer for women at work.